updates from demonstration sites – National Trust and ABP Foods

The installed system at Penrhyn castle could only operate in one of the proposed configurations, configuration 2, shown in Figure 1. The operation was observed from January 24th to March 21st, however the kitchen only opened for visitors on February 17th. The system showed a reduced heat demand from the biomass boiler, equivalent to 594 kWh per year, when extrapolated. This is equivalent to a reduction of about 215 kg technical Ce emissions. However, as it is replacing biomass, only 9 kg of these qualify for the company reporting.

Figure 1. Operating configuration at Penrhyn castle

Figure 1. Operating configuration at Penrhyn castle

Figure 2. The DWHR system at Penrhyn castle

Figure 2. The DWHR system at Penrhyn castle

The system increased the incoming water temperature from an average of 11.75°C to 17.59°C, as shown in Figure 3. After March 21st the operation was halted due to the COVID-19 crisis.

This is smaller than the predicted recovery, due to the lower water consumption of the kitchen during this operation period than at the time of the feasibility study (293.05 l/day vs 652.5 l/day). A simpler configuration, where the incoming fresh water is simply preheated, was deemed more profitable. This is mainly due to its smaller capital investment, and the fact that no additional pumping is required.

Figure 3. Incoming and preheated water temperature at Penrhyn castle

Figure 3. Incoming and preheated water temperature at Penrhyn castle

The system at ABP operated for a full week at the outlet of the Dissolved Air Flotation unit (within the wastewater treatment system), as shown in Figure 4 and Figure 5.

Figure 4. The DWHR unit at ABP

Figure 4. The DWHR unit at ABP

Figure 5. The wastewater intake at ABP

Figure 5. The wastewater intake at ABP

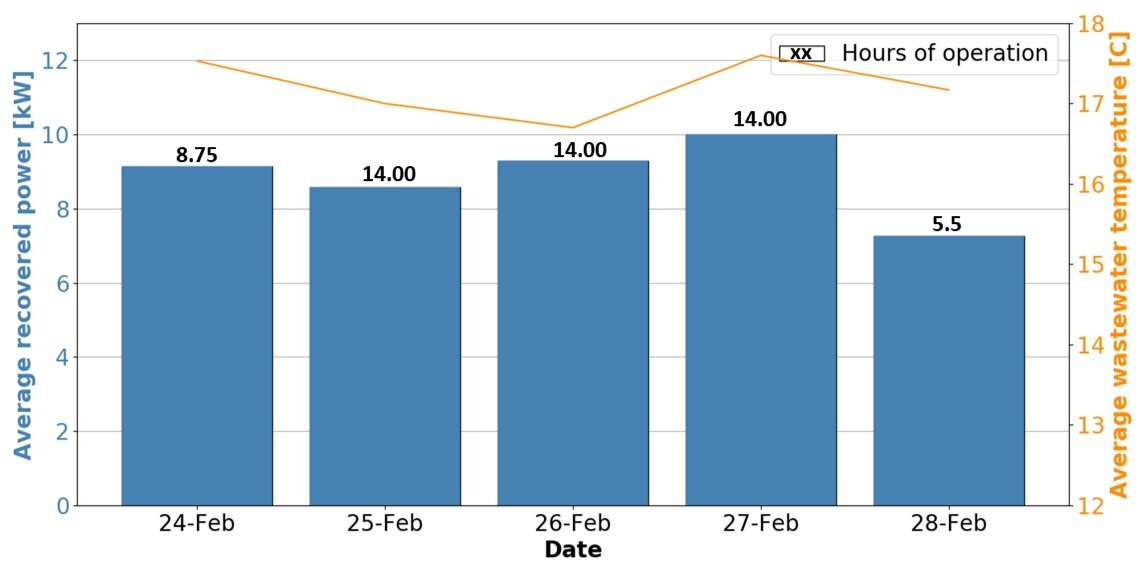
The unit recovered 120-140 kWh per day, at an average heating power well above 8.5 kW, as can be seen in Figure 6

Although these results are encouraging, multiple challenges occurred because of the experimental parallel nature of the DWHR unit. At first, the wastewater was pumped from the DAF outlet into the experimental unit, back into the inlet sump. However, this required an increased forward pumping of the wastewater in the treatment system, increasing pumping consumption and required chemical dosage. To counteract this, the system was adapted and installed in-line, after running through the experimental unit, the wastewater was pumped back up to the DAF outlet. However, this changed the hydraulic characteristics of the system, moving from an open gravitational system, to a pressurised system. The experimental unit, being designed for operation in the former, could not withstand the additional pressure associated with the latter. Adaptations to the system were ongoing, but interrupted by the COVID-19 crisis.

Figure 6. Operation of the DWHR unit at the DAF outlet at ABP, Cahir
Figure 6. Operation of the DWHR unit at the DAF outlet at ABP, Cahir

Emission abatement potential of low-carbon technologies for space and water heating in households

By Annum Rafique

michael-shannon-I47lLEgVlso-unsplash.jpg

Under the Environment (Wales) Act 2016, the Welsh Government is required to reduce GHG emissions in Wales by 80% by 2050 (compared to 1990 level) (WG, 2019). Considering this legislation, the Welsh Government has improved its efforts to combat climate change by reducing emissions through all sectors of the economy including the residential sector. Households are also becoming more aware of their carbon footprint and are increasingly concerned about the environment. This has created a great potential for emissions abatement from household energy use for space and water heating. Low-carbon systems could play an integral part in addressing climate change and the future of energy systems.

The reduction in household emissions due to low-carbon systems such as PV, biomass boilers (Wood Pellets and Chips), Air Source Heat Pump (ASHP) and Ground Source Heat Pumps (GSHP) were measured for residential houses in Gwynedd, Wales. Approximately 71% of houses in Gwynedd used gas for space and water heating, followed by electricity (15%), then oil (8%), LPG (5%), and lastly, coal (1%) resulting in 0.3 Mt CO2 emissions per year. We aimed to introduce a variety of policies that may be implemented to shift from conventional to low-carbon technologies in hopes of reducing household emissions. Three alternative policy scenarios were constructed to capture the effect of policy changes that may influence a low-carbon technology’s investment costs, the market penetration of the technology and improvement in energy efficiency.

The first scenario assumed that over the years, the production efficiency of low-carbon technology would increase, leading to a reduction in the cost of technology (CCC, 2015). Due to the reduction in cost of technology, the uptake of these technologies by consumers would also increase. This scenario assumed an increase in market penetration by technology due to a reduction in investment costs. With the increase in market share of these low-carbon technologies, the market share of gas as an energy source would decrease in parallel. Under this scenario, the emissions from energy use in houses in Gwynedd reduced to 0.2 Mt CO2. The second scenario assumed that over the years, the trend of increase in energy prices would continue. Moreover, the emissions from electricity would decrease due to the decarbonisation of electric grid. Under such a scenario, the total emissions reduced were 0.12 Mt CO2 per year.

The third scenario included a combination of policies which assumed that the penetration rate of low-carbon technologies has doubled from the current trend followed by a reduction in investment costs. The future rise in energy costs was also considered along with a reduction in emissions from electricity use. The total emissions abated in a year rose significantly to 0.19 Mt CO2 per year under these policy changes.

Hence, the largest emission saving and reduction was achieved by a combination of policies that not only increased the share of low-carbon technologies in homes but also lowered the carbon content of electricity through decarbonisation of electric grid.

References
CCC 2015. Sectoral Scenarios for the Fifth Carbon Budget.
WG 2019. Welsh Government. Prosperity for All: A Low Carbon Wales.

Changing river flows under a worst-case climate change scenario: Implications for drinking water supply

By Richard Dallison

Water service providers in the UK face a vast array of challenges when it comes to planning their future operations and services; the impact of climate change on the amount of water available for supply to consumers is key among these. Changes in seasonal and annual average river flows are driven by average precipitation levels, while the extreme river flow events (both high and low flows) are effected by the frequency, duration and intensity of single precipitation events. Potential alterations in both averages and extreme flows are important to understand for water supply in order to be able to maintain a continued consistent supply of clean drinking water in the future.

Using the Soil and Water Assessment Tool (SWAT) hydrological model, we have projected and analysed future river flows from 2021 to 2079 under a worst-case scenario of future emissions, that being representative concentration pathway 8.5, as laid out by the Intergovernmental Panel on Climate Change. To account for uncertainty in future modelling, an ensemble of 12 regionally downscaled models derived from the Met Office Hadley Centre Global Environmental Model (HadGEM3), and supplied by UKCP18, have been used as the future climate inputs to SWAT. Five catchments have been studied, the Clwyd and Conwy in north Wales; the Dyfi in mid-Wales; and the Teifi and Tywi in south Wales; these systems represent a variety of catchment characteristics in terms of land use, soil types, underlying geology and topography.

Study areas and catchments showing streams larger than third order as defined by Strahler method.

Study areas and catchments showing streams larger than third order as defined by Strahler method.

Both annual/seasonal average, as well as extreme events, have been analysed for the full 59-year dataset and for all 12 model outputs, the results presented below are based on Mann-Kendall trend analysis of the average of these 12 models for each catchment. In terms of seasonal averages, in all catchments a statistically significant increase in average spring flows is observed across the timeframe, this is matched with a corresponding decrease in autumn flows, significant in all catchments except the Dyfi. Winter and summer flows are only significantly effected in the 3 most northern catchments, with winter flows increasing in the Conwy and Dyfi, but decreasing in the summer; the reverse trends are observed for the Clwyd. All catchments except the Dyfi display a downward trend in annual average river flows, albeit this trend is only statistically significant in the Clwyd catchment. Conversely, annual average flows in the Dyfi show a statistically significant increase through the study period.

When looking at extreme events we have studied four factors, and all have been analysed seasonally and annually: one-day maximum flow volume; one-day minimum flow volume; the number of days where flows are above the 95th percentile value for the full 59 year seasonal or annual dataset; and the number of days that are below the 5th percentile value for the full 59-year dataset. As with the average flows, the changes that are most consistent across all catchments are seen in autumn and spring. In particular, autumn flows are decreasing in volume on average over the study period, with trends towards a greater number of events below the 5th percentile, fewer events above the 95th percentile, and lower one-day minimum and maximum flow volumes. Spring extreme events correspond with the seasonal average results discussed above, with a significant increase in the number of days with a greater flow volume than the average value for the whole dataset through the study period.

Visual representation of the direction and significance of trends observed in seasonal and annual river flow volumes during the period of the hydrological years 2021 to 2079, as detected by Mann Kendall trend analysis.

Visual representation of the direction and significance of trends observed in seasonal and annual river flow volumes during the period of the hydrological years 2021 to 2079, as detected by Mann Kendall trend analysis.

Given that in four of the five catchments we see decreases in annual average river flows, as well as summer and autumn flows in particular, this could pose a problem for water supply in the future, especially when it is considered that this is usually the period of peak water demand. Increases in the average volume of spring flows in particular, as well as winter flows to a lesser extent, will help to remediate some scarcity, but this is only beneficial if there is sufficient capacity to store additional water in these periods. Further pressure could also be placed on water service providers if projected increases in the number of arid days of the period come to fruition. More frequent shallow flows could affect abstraction license conditions, meaning that water companies would be unable to abstract as much, or even any water from certain abstraction locations, as there would not be sufficient ‘hands off flow’ remaining. A further concern during the projected increased number of very large discharge events (in spring in particular) is changing incoming water quality. Large discharge events could put increased pressure on drinking water treatment plants due to increased turbidity and sediment loads in particular, as well as other pollutants washed from the land in such events. It is clear that the projected changes in the river flows could have a large impact on a variety of aspects of drinking water supply. Work is needed now to plan and mitigate against these potential changes in order to maintain continued supplies into the future.

Model predictive control as a way to maximize power production in Pump-as-Turbines

Using pump as turbines coupled with control valves can produce power and achieve pressure regulation at the same time. Pumps operating in the reverse mode can be used as an alternative to other hydro turbines due to its low payback time, low cost and low maintenance. Dŵr Uisce aims to install PATs in water networks using control valves in a configuration called the hydraulic regulation (HR). The figure 1. below shows the HR configuration in a graphical representation.

Figure 1 PAT in HR scheme

Figure 1 PAT in HR scheme

In HR scheme, there is a control valve used rather than a pressure reducing valve in which the pressure setting is constant rather than changing which is the case in a real network with flow variations throughout the day. The main advantage of using a control valve over a pressure reducing valve, better pressure regulation can be achieved due to fast closing and opening times. There are many types of control valves in the market for e.g., Ball, Globe, Butterfly, etc. The figure 2. below shows a better understanding of the types and relationship of flow with OD.

Figure 2 Types and relationship with flow and OD of different types of valves

Figure 2 Types and relationship with flow and OD of different types of valves

WP3_2.png

For this work, globe valve is selected due to its linear relationship with flow rate and opening degree rather than compared with other types for e.g.: Butterfly valves have a non-linear relationship with flow and opening degree.

After selecting the best type of valve for the network and using the characteristics to model it, the next step is to model the PAT. Using a method developed by a fellow contributor to the Dŵr Uisce project, PAT model can be used combining with the valve model to use Model Predictive Control to maximize the power output based on the optimal flow and changing the Opening degree of the valve to accommodate it. Model predictive control is an advance control strategy used to control a process while satisfying a set of constraints. The main advantage of MPC is, it optimizes the current timeslot based on the past values, while keeping the future timeslots in account. This technique can be used to maximize the power output from the PAT based on the optimal flow which can be calculated and changing the opening degree of the valves accordingly to achieve pressure regulation.

Learning to use waste water heat recovery technology

By Isabel Schestak

Every human activity and every manufactured product carries an environmental footprint – that is no different for appliances or installations required to make water use more efficient. In this project, we look for example on the environmental footprint of a heat recovery system to recover heat from drain water.

A smart choice of materials and design can lower this footprint substantially and reduce emissions and resource use. By applying the Life Cycle Assessment (LCA) methodology, we determine the best way to design sustainable heat recovery systems. This is called eco-design.

Heat+recov+system+schematic.jpg

We are aiming to make the eco-design guidelines for heat recovery systems available to all businesses who are interested in using this technology. This will be facilitated by a toolkit. Free to use and publically available, the toolkit will provide two things: firstly, advice for decision making such as: Is my facility a potential candidate for recovering heat from drain water? And secondly, giving advice from a design perspective: Which technology can be used and which materials are recommended?

The recommendations for business owners will be based on individual information that the users fill in themselves, such as data on the water use amount and pattern. Examples for businesses are restaurant and pub owners, breweries, distilleries and many more operating in and outside the food sector.

With the tool, business owners will have the chance to not only reduce the environmental impact of their activities but also save energy and costs for heating water.

Hydro-power Energy Recovery in Deep Mines

By Himanshu Nagpal

Extensive amount of water is used in deep underground mines for various purposes like mineral processing, drilling, dust suppression, washing equipment, ore transport in slurries and refrigeration (for deep mines). Australia’s mining industry water consumption in 2008-2009 was 858 M m3 where as Canada’s mining industry water consumption in 2009 was 675 M m3 . The Boliden Tara Mines site in Ireland is the Europe’s largest zinc mine, the world 9th largest. Underground mining in Tara mines requires around 4.5 million m3/yr of water.

Due to high elevation change, the pressure of used water becomes very high at deep levels of mine. Pressure reducing valves (PRVs) are used at regular intervals to maintain the allowed pressure in pipes which can range from 6 – 12 bar. The used water must be pumped out (dewatering of the mine) using pump stations at various locations. This dewatering of mine is an energy intensive process. For Tara mines, the pumping contributes 10% to its total energy consumption (185 GWh/yr). This potential energy of water going down the mines shaft can be recovered using pump as turbine (PATs) in place of PRVs.

Example Case Study –

  • Kopanang Gold mine

  • Free state, South Africa

  • Single shaft mining at depth of 1350 m and 2240 m.

Figure 1 shows the simplified mine water reticulation network for this mine

Figure 1 Simplified mine water reticulation network

Figure 1 Simplified mine water reticulation network

The average water consumption of the mine is around 19 Ml/day or 220 l/s. The available elevation head is 2286 m. The required pressure in pipes is 100 m or 10 bar.  The theoretical energy consumption of dewatering the mine is

WP1_Himanshu_Equation.JPG

Figure 2 shows the mine reticulation network with energy recovery devices. PATs are installed in place of PRVs and a turbine pump is installed on a single shaft.

Figure 2 Mine water reticulation network with energy recovery devices

Figure 2 Mine water reticulation network with energy recovery devices

The PAT design conditions for specific production level:

  • Average water flow on the production level – 110 l/s

  • Average Upstream pressure – 52 bar

  • Average downstream pressure – 10.5 bar

  • Efficiency – 77.2 % (based upon pump-turbine efficiency curve)

  • 353 kW of power at peak flow of 110 l/s and efficiency 77.2%

  • Investment cost – 230,000 Euros

  • Payback period – 3.8 years

Requirements for TARA mines

 Our objective is to do a feasibility study to estimate the potential of hydropower recovery in Tara mines based upon measured data. The steps involved in the feasibility study are as follows

  • Measurements of flow data though PRVs

  • Measurements of pressure drop data across PRVs

  • Based upon the measurement of flow and pressure data, define a design-criteria for PAT

  • Cost estimation base upon designed system

  • Estimate cost savings and payback period

Anticipating future water scarcity from climate change

By Richard Dallison

Water service providers in the UK face a vast array of challenges when it comes to planning their future operations and services; climate change impacts on the amount of water available for supply to consumers is key among these. In the future we are likely to see longer more accentuated seasons, this is particularly true for winter and summer, which are likely to become more cold and wet, and more hot and dry respectively.

This change in the timing and quantity of surface water available for abstraction by water companies for supply to consumers could lead to water scarcity problems unless steps are taken now to look at the scale and precise nature of these changes and to plan the necessary management to protect against these changes. For example, lower amounts of summer rainfall are likely to be compensated for by larger amounts of precipitation in the winter. However, if reservoirs already fill to capacity in the winter, and no new storage is developed, then this additional winter rainfall cannot be taken advantage of to help with the dryer summers. This is particularly true for Wales, as the vast majority (~97%) of water abstracted for supply to consumers is taken from surface water sources, in particular from upland impoundment reservoirs.

WP7_SWAT.jpg

 By using hydrological models, such as the Soil and Water Assessment Tool (SWAT), we can look at how projected future climate changes will impact on surface waters. In particular in our work we have taken a worst case scenario approach in terms of future emissions, with representative concentration pathway 8.5 being considered – the IPCC scenario with the highest level of future greenhouse gas emissions. SWAT is a highly detailed hydrological model, which allows investigation of not only the changes in the quantity and timing of water supply, but also the quality of that water. To this end, we can investigate how pollutants such as nitrogen, phosphorous, and suspended sediments will alter under climate change. Alterations in water quality could impact heavily on water companies, as more polluted water may require more rigorous treatment at drinking water treatment plants. These increases in required treatment to maintain drinking water quality standards could have impacts on the operational efficiency of the plants, both financially and in terms of energy use. In certain cases, it may even be required to upgrade plants with new technologies and treatment methods in order to cope with such changes.

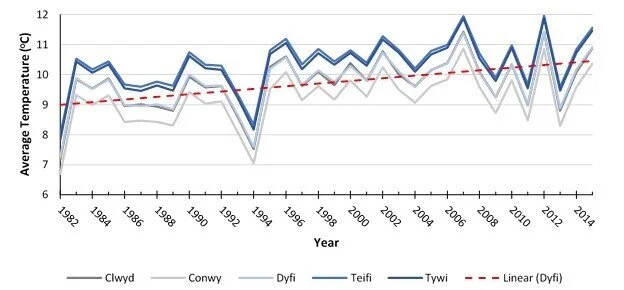
Warming trend in average autumn temperatures displayed five catchments in Wales. Linear trend line for the Dyfi catchment shown in red to exemplify the linear trend in all catchments

Warming trend in average autumn temperatures displayed five catchments in Wales. Linear trend line for the Dyfi catchment shown in red to exemplify the linear trend in all catchments

Furthermore, if we also look at how demand for water is influenced by weather conditions, we can see a strong positive correlation between total water use (domestic, agricultural and industrial) and average daily temperature. When it is considered that future summers are likely to become warmer and dryer, this relationship is likely to put increased pressure on a supply-demand balance that may already be water scarce due to reduced summer rainfall. We can already see the effect of the aforementioned prolonged seasons, with summer temperatures stretching further into the autumn over the past 30 years; the below figure shows the increase in annual autumn temperatures between 1982 and 2015 for the five catchments in Wales. This figure demonstrates the further the need for thorough water resource management planning in order to ensure the continued supply of clean drinking water into the future.

Festive wishes from Dŵr Uisce

Thank you for collaborating with the Dŵr Uisce cluster during 2019. Together, we have innovated! Looking forward to 2020, we will be running several workshops, events and initiatives in the New Year. Our next newsletter will be published in February. Merry Christmas!

Xmas greeting-01.jpg

Benchmarking energy and economic efficiency across water utilities

By Nathan Walker

Benchmarking is the practice of comparing processes via performance metrics against each other, in order to ascertain a best practice for that process for others to learn from. The process in question can almost be anything, from rollercoasters and snooker chalk (yes, really) to pumps and water companies. Due the nature of our project, water companies were the subject of benchmarking in this research. Despite the UK water sector being mature in benchmarking, we believed we could add extra value to the companies, as well as academia, by applying new methodologies to analyse the efficiency of their operations, along with factors that may influence those efficiencies.

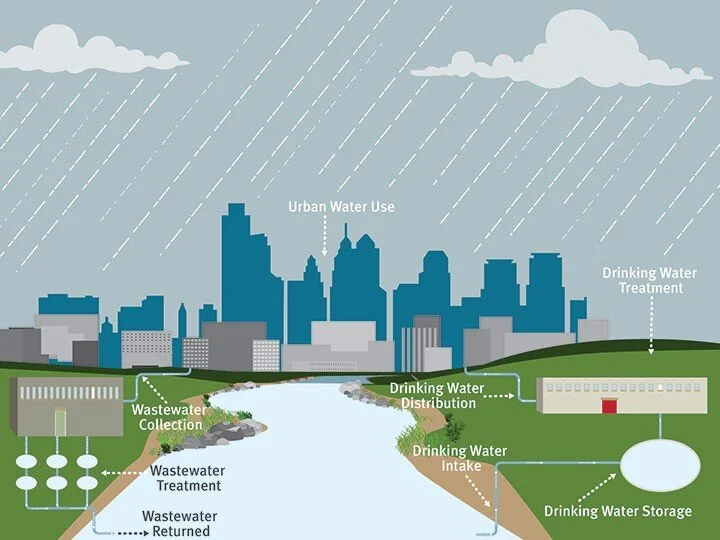
Figure 1. A basic schematic of the operations that a water utility conducts.

Figure 1. A basic schematic of the operations that a water utility conducts.

Initially, the approach in benchmarking comprised of stand-alone indicators (e.g. volume of water produced). Then to encompass at least some fairer level of comparison, partial indicators became prominent such as volume of water produced/population served and spending/volume of water treated. In academia, benchmarking has largely branched in to techniques that are slightly more complex. We chose data envelopment analysis (DEA), a non-parametric frontier approach to analyse a sample of UK and Irish water and sewage companies, which has the advantage of integrating multiple input and output metrics, and giving a value for each company that is determined relative to others in the sample. Specifically, we utiltised a double-bootstrap version of DEA that allows statistical inferences and hypothesis testing, essentially meaning we could investigate how other indicators may influence the efficiency of a company’s core operation (inputting energy and money to produce clean drinking water and treat wastewater), whilst avoiding some statistical errors that occur with techniques that similar objectives.

Results from the research indicated that companies across the UK and Ireland could on average reduce their economic and energy inputs by 19% and 16%, whilst maintaining the same levels of water delivery and treatment outputs. Furthermore, we found that the method we used changed the rank of over 65% of the companies, compared to the standard DEA model, showing the importance of utilising the most appropriate approach design. Finally, research so far has highlighted external variables that influence efficiency. Population density and the percentage of water abstracted from surface water showed to have a significant positive impact on both economic and energy efficiency, whilst leakage and number of abstraction sources were concurrent in their significantly negative influence across both energy and economic performance. Moreover, average pumping head height and consumption per capita displayed a significant negative effect for energy, conversely the variable proportion of water passing through the largest 50% of treatment works was deemed to have a significant negative effect on economic efficiency. Recommendations from this area of the research so far include: reduction campaigns for consumers, leakage reduction, evaluating security of supply vs. efficiency for number of sources, assess the potential to reduce head heights within new and existing networks, and investigate the optimal size of treatment plant to utilise economies of scale.

Some of these results are quite rare, whilst some may seem more obvious, however giving evidence towards certain areas helps to inform decision-making and prioritisation. This is one of the key advantages that benchmarking can offer, along with identifying those who have best practice, the idea being that the benchmarking ultimately facilitates sharing of these best practices. To ensure benchmarking can facilitate companies to perform optimally, improvements in transparency and communication is still required, which in theory is one of the easier hurdles to leap since the water sector already collects and stores the crucial data.