Nathan Walker
The team have conducted an international energy efficiency benchmarking exercise on wastewater treatment. The results showed that EU states have the highest electricity intensity (kWh/m3) seemingly due to higher wastewater effluent standards however, the impacts on greenhouse gas emissions are widely varied depending on individual country fuel mixes. These findings inform future research by suggesting improvements around data reporting and sharing, particularly influent vs effluent, and gross vs. net energy consumption data.
The collection, treatment and disposal of wastewater is a significant consumer of energy, with estimates suggesting that more than 2% of the world’s electrical energy is used for water supply and wastewater treatment (Olsson, 2015). Kenway et al. (2019) report that wastewater treatment plants (WWTPs) can consume over 20% of electrical consumption within municipalities. Reducing the energy consumption of wastewater management is integral to efficient resource use within a circular economy and to reduce greenhouse gas (GHG) emissions.
This task is more difficult considering WWTP electricity demand within developed countries is expected to increase by over 20% in the next 15 years as controls on wastewater become more stringent (Wang et al., 2012; Hao et al., 2015); with the same trend expected in developing countries as wastewater quality becomes a greater priority (Lopes et al., 2020).
A valuable tool for improving wastewater energy intensity amongst water companies is benchmarking. By utilising key performance indicators, it is possible to find the optimal performers and evaluate companies against similar entities or standardised values (Torregrossa et al., 2016). By doing this, companies can identify and prioritise areas for improvement and learn from best practices (Walker et al., 2021).
We conducted an international benchmarking exercise on wastewater energy intensity, measured in kWh/m3, in attempt to understand who the best performers are and the reasons behind their performance. The core sample included 321 companies from 31 countries, however, to analyse regional differences, 11 countries from an external sample made up of various studies of WWTPs was also used in places (Figure 1).
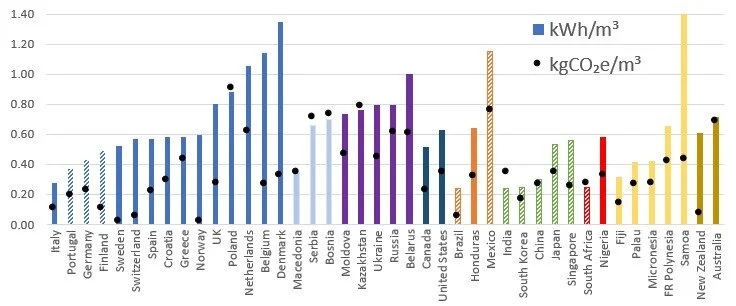
Figure 1. Energy intensity (kWh/m3) and associated greenhouse gas emissions (kgCO2e/m3), stiped bars are from external data sets (individual, treatment plant studies).
EU states had the largest average kWh/m3 with 1.18, which appeared a result of the higher wastewater effluent standards of the region. This was supported by Denmark being the second largest average consuming country (1.35 kWh/m3), since it has some of strictest effluent standards in the world. All other regions averaged much lower, ranging between 0.58-0.64 kWh/m3, apart from Russia and the former states of the Soviet Union who averaged 0.82 kWh/m3. This appeared to be a symptom of the energy data being gross consumption (as opposed to net) and there being a disparity between wastewater quality standards, since energy production at WWTPs was not captured and the lowest energy consumers had some of the worst standards, and vice versa. It is expected that as regions with lower effluent standards improve to similar levels of advanced economies, their energy consumption will increase too.
The influence of energy consumption on GHG emissions was diverse owing to interaction with widely differing emission intensities of grid electricity: Poland had the highest carbon footprint with 0.91 kgCO2e/m3, whilst Norway emitted just 0.013 kgCO2e per cubic meter of, despite consuming 0.60 kWh/m3, showing the importance of energy intensity on particular infrastructures. Although this study provided some valuable quantifiable results, the conclusions stemming from the limitations of carrying out the benchmarking exercise are just as crucial.
There is a lack of quantity, quality, and granularity in existing global wastewater data, making it difficult to fully analyse the impact and potential paths to improve wastewater treatment. A lack of data generally leads to a lack of representativeness of certain regions, skewing comparisons with limited sample sizes.
The two changes that would have the most significant impact for future analyses are to have influent vs. effluent quality and net energy consumption data, which would increase the accuracy of studies, circumnavigating varying legislative effluent standards and compliance rates.
References
Hao X, Liu R, Huang X (2015) ‘Evaluation of the potential for operating carbon neutral WWTPs in China’. Water Res. 87, pp. 424–431. https://doi.org/10.1016/j.watres.2015.05.050
Kenway, S.J.; Lam, K.L.; Stokes-Draut, J.; Twomey, K.S.; Binks, A.N.; Bors, J.; Head, B.; Olsson, G.; McMahon, J.E. (2019). Defining water-related energy for global comparison, clearer communication, and sharper policy. J. Clean. Prod. 236, 117502.
Lopes, T. A. S., Queiroz, L. M., Torres, E. A. and Kiperstok, A. (2020) ‘Low complexity wastewater treatment process in developing countries: A LCA approach to evaluate environmental gains’, Sci. Total Environ. 720, 137593. doi: doi.org/10.1016/j.scitotenv.2020.137593
Olsson, G. 2015. Water and energy: threats and opportunities, second ed. London: IWA Publishing.
Torregrossa, D., Schutz, G., Cornelissen, A., Hernández-Sancho, F. & Hansen, J. (2016) Energy saving in WWTP: daily benchmarking under uncertainty and data availability limitations. Environ Res, 148, pp. 330–337.
Walker, N. L., Styles, D., Gallagher, J. Williams, A. P. (2021) ‘Aligning efficiency benchmarking with sustainable outcomes in the United Kingdom water sector’, J. Environ. Manag., 287, pp. 112317. doi: 10.1016/j.jenvman.2021.112317
Wang, X., Liu, J., Ren, N-Q., Yu, H-Q., Lee, D-J., and Guo, X. (2012) ‘Assessment of multiple sustainability demands for wastewater treatment alternatives: a refined evaluation scheme and case study’, Environ Sci Technol., 46(10), pp. 5542-5549. doi:10.1021/es300761x