By Jan Spriet
Wastewater from (commercial) kitchen drains can reach temperatures up to 55°C, consequently, they have a significant amount of embedded energy (that you paid for), that is currently being flushed down the drain. In commercial kitchens the installation of a pre-treatment system, to remove Fat, Oil & Grease (FOG) from the wastewater is mandatory, to avoid fatberg formation. In commercial kitchens, this pre-treatment is performed by a grease interceptor or grease trap. In the proposed prototype, this grease interceptor is used as a wastewater holding reservoir, avoiding temporal mismatches, and a heat exchanger is integrated into this grease interceptor. The heat recovered from the grease trap reduces the energy and fuel consumption of the kitchen’s traditional heating system. Integrating heat recovery in the grease trap would not only reduce the space requirements of heat recovery systems, and reduce their installation costs. It would also aid in the removal of FOG from the kitchen wastewater. In this article, we describe the operation of our prototype.
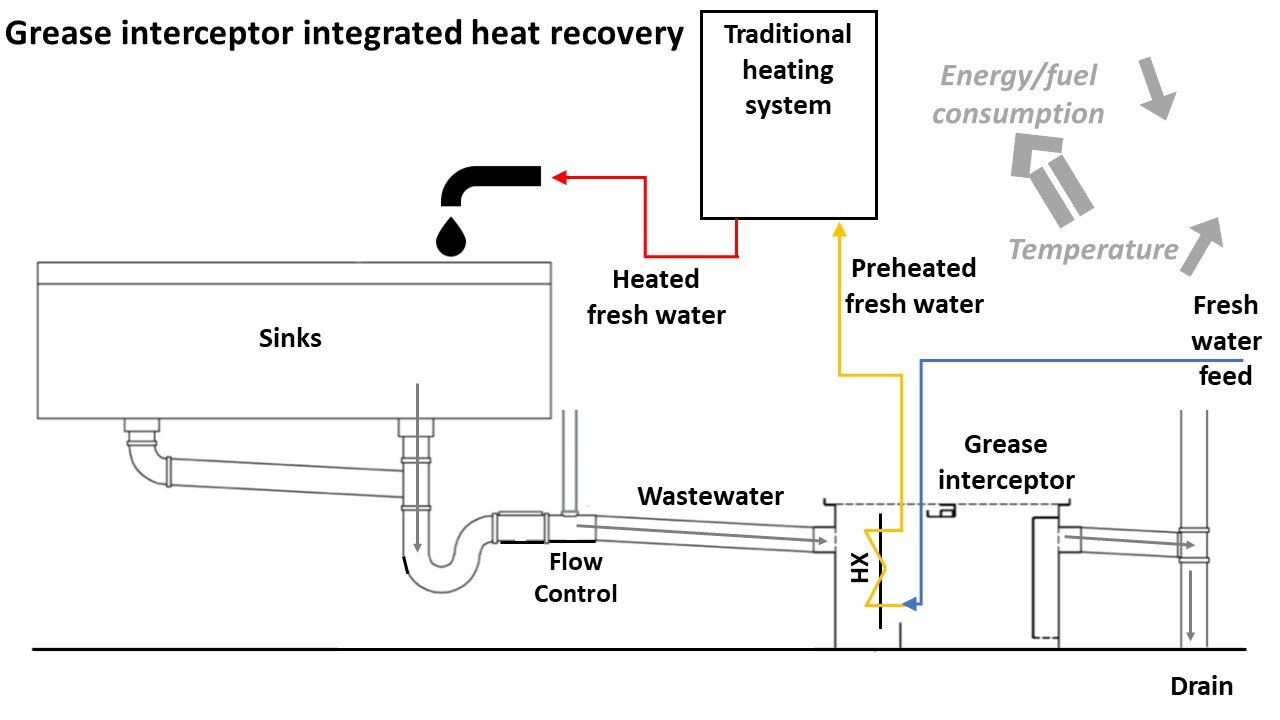
Figure 1. The working principle, in a nutshell.
Our previous research showed a technical heat recovery potential of 1.4 TWh (388 000 tons of carbon emissions) in the food and hospitality sector in the UK, each year, using currently available heat exchangers. However, it also showed that this potential was limited by temporal mismatches between supply and demand, a required vertical drop in the drain of 2m, and showed that these heat exchangers are not cost-effective for smaller kitchens. The idea of the developed prototype was to address these three bottlenecks. The solution was found by integrating heat recovery into grease interceptors. These grease interceptors are already a mandatory piece of equipment, this would thus not require additional space, and have a limited effect on costs.
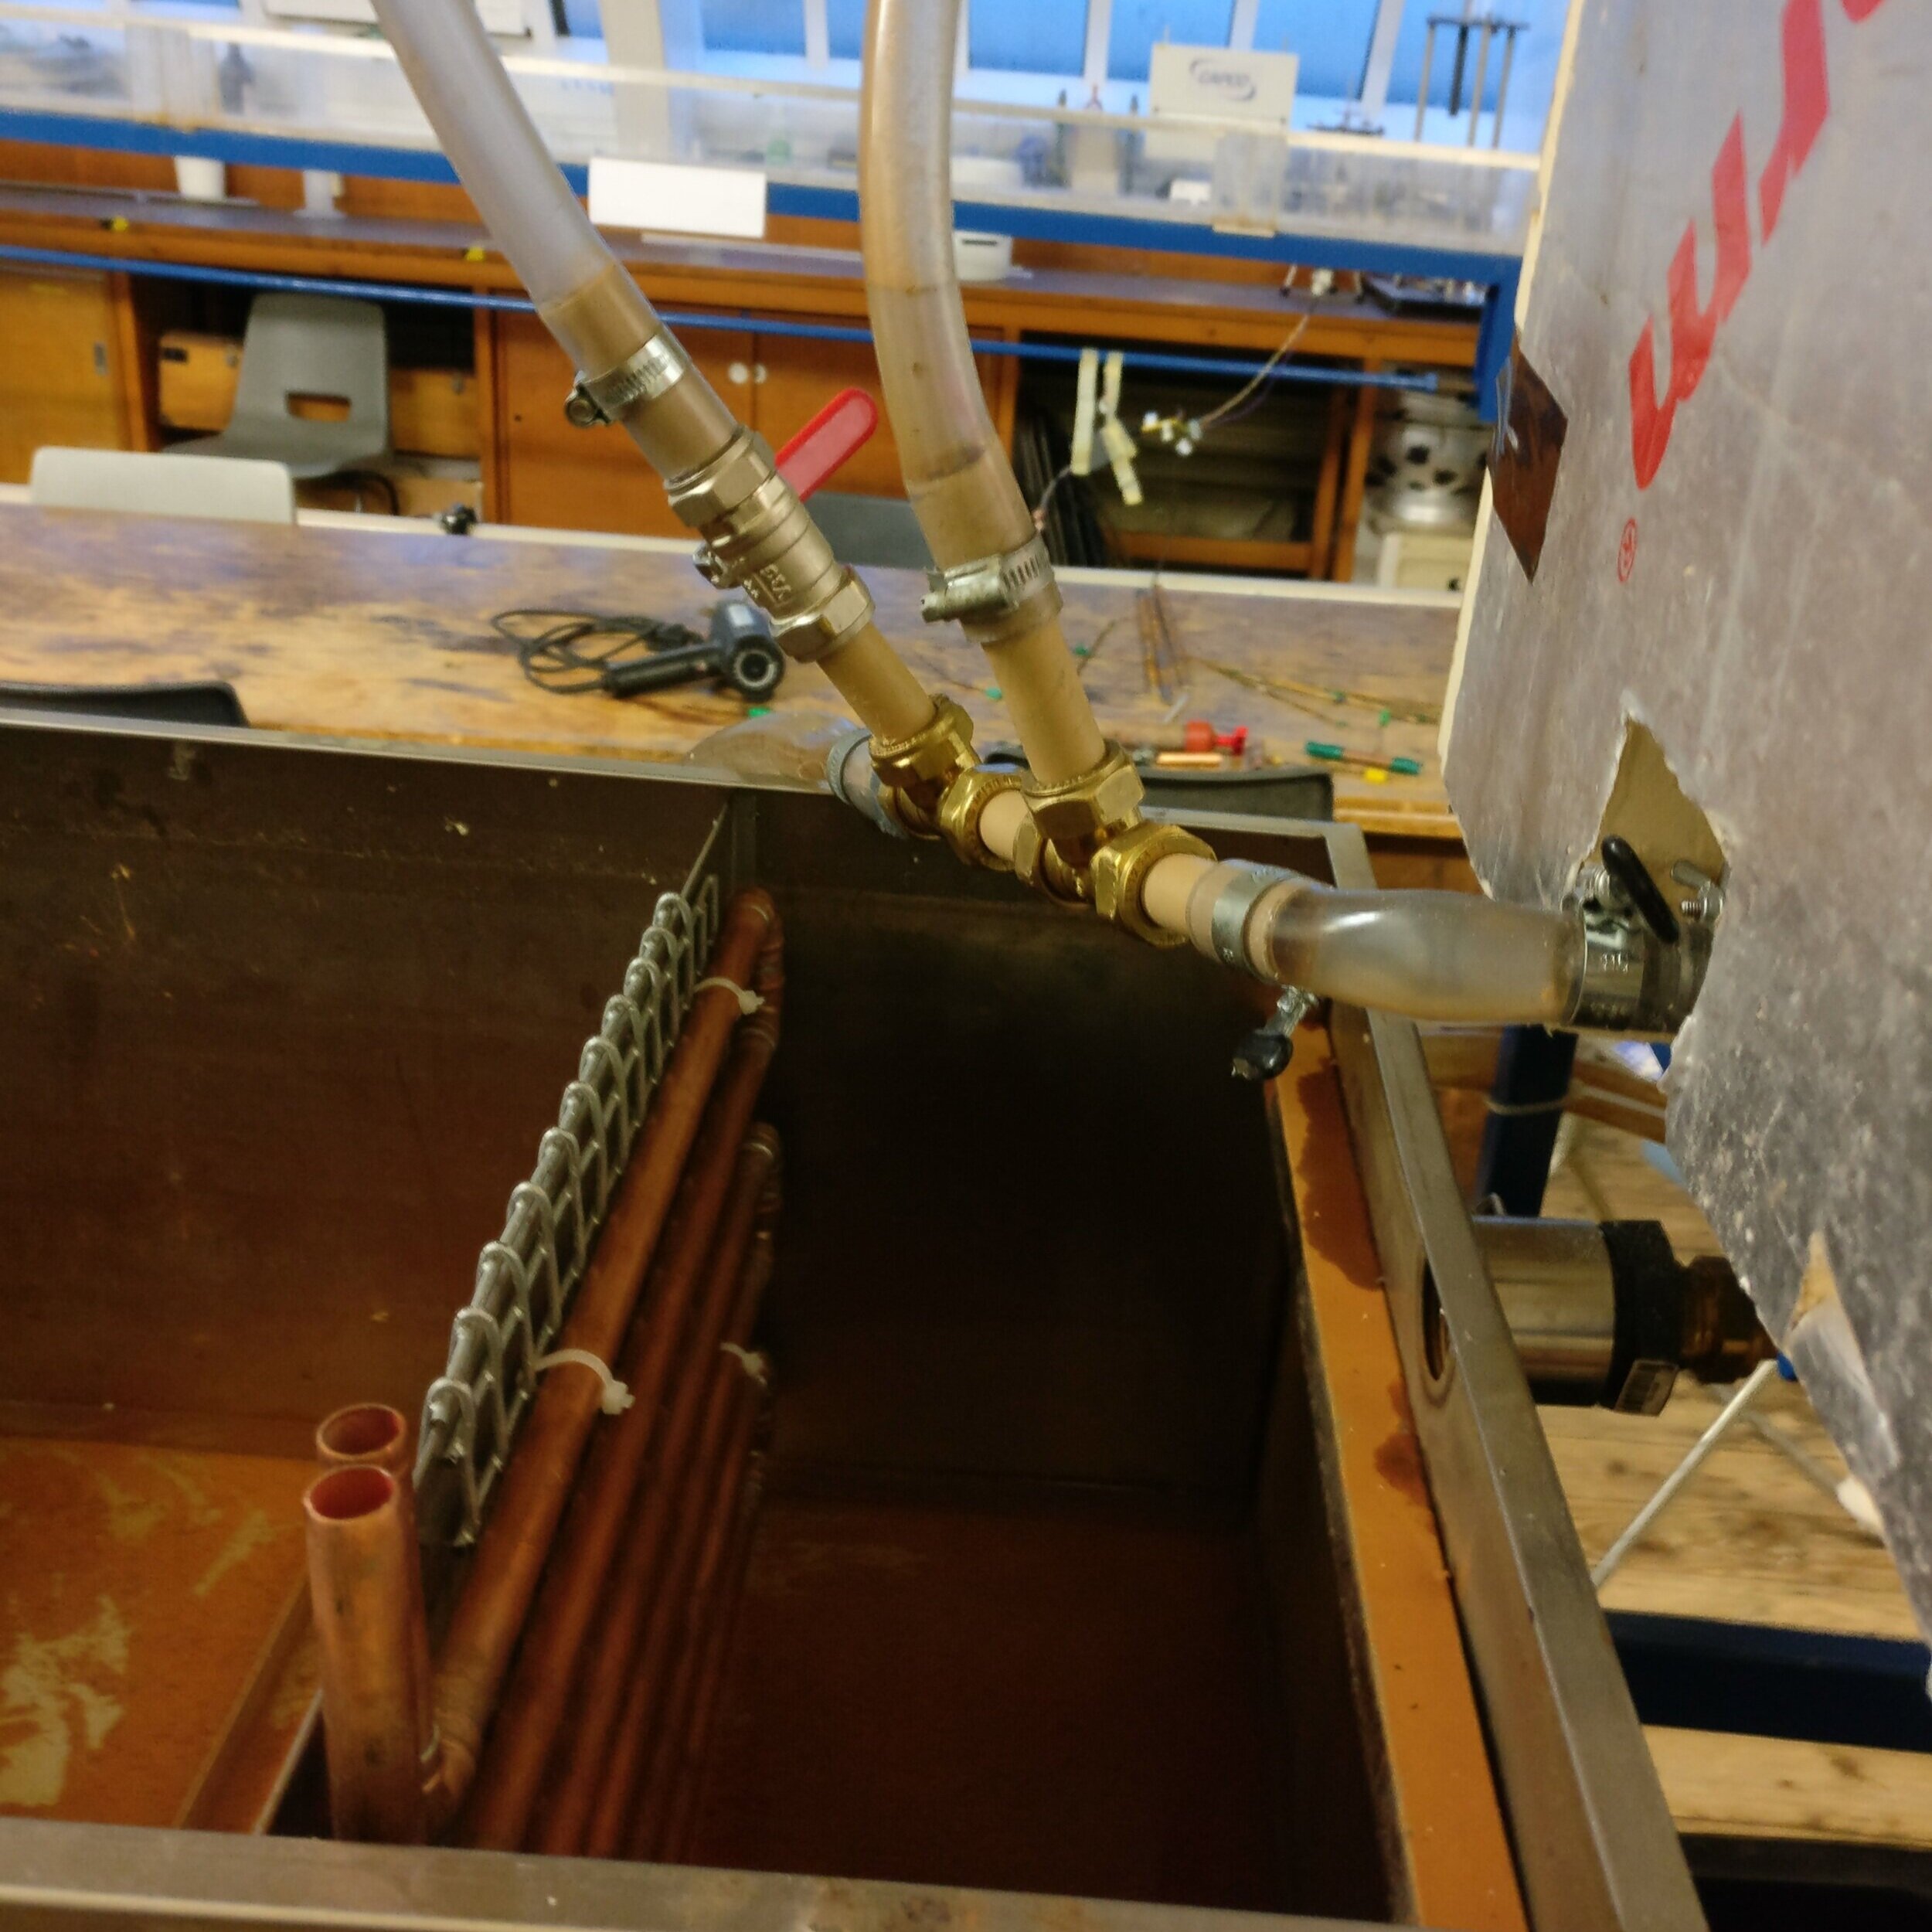
This prototype was tested in steady state conditions in the lab, using heated clean water to simulate the kitchen’s wastewater. This showed an effectiveness between 23% and 55%, and a recovered heat ranging between 600W and 1.8kW. It also reduced the temperature in the grease trap from around 41.5°C in normal conditions to 36.5°C at its lowest point

Figure 3. Heat recovery prototype in the lab set-up
The prototype is deemed profitable for kitchens with a consumption of more than 100 l/day, when complementing electric heating and 300-350 l/day when complementing traditional boilers (fuel oil, natural gas or bio-mass). Applying this prototype in the food and hospitality sectors results in over 150 000 food outlets, where installing the prototype is the most profitable solution. These outlets equate to 2348.52 GWH of heat recovery each year, the equivalent of 69 000 tons of greenhouse gas emissions.
The reduced temperature is expected to improve FOG removal efficiency, which in turn would increase the required emptying frequency of the grease interceptor, as more FOG would be collected. Collecting more FOG has the advantage that, when the removed FOG is treated in anaerobic digesters, additional bio-gas can be recovered.