Benchmarking of Water Networks to Deliver Efficiency
Benchmarking is regarded as a valuable tool for increasing efficiency because it can be used to evaluate the comparative performance of companies, enabling meaningful sharing of best practices.
In the sections below you will find the findings and highlights of our results from the benchmarking efficiency studies on the water industry, which collectively covered Ireland and Wales, the wider UK setting, and the rest of the world.
How do Ireland and Wales compare to the UK?
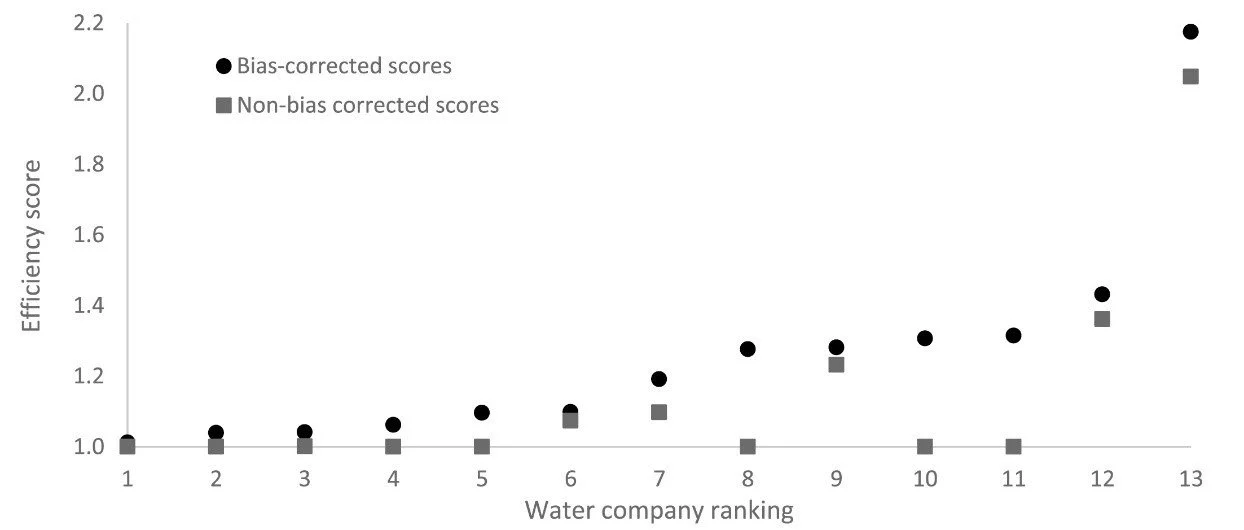
We found that the UK, including Wales, have similar levels of economic efficiency when assessing how much potable water companies produce and wastewater they treat relative to how much they spend. Ireland was found to be lagging behind on economic efficiency (company 13 in Figure 1), which was especially apparent when water and wastewater quality were incorporated into the analyses.
We have also investigated how explanatory variables affect results. Some results are more obvious such as increased leakage and population density being linked with more efficient companies. Whereas factors such as the size of wastewater treatment plants contradicted expectations that the economies of scale present in treatment plants would have a positive relationship with efficiency. Instead, it appeared that there is a cut off size where economies of scale reduce and there are diminishing returns to such an extent that the extra infrastructure, like piping, required to operate around a large central unit, can mean the largest treatment plants contribute negatively to the efficiency of a company.
How methods can influence results (and why that’s important)
Figure 1. Economic efficiency scores and rankings. An efficiency score of 1 = optimum efficiency, the further scores are away from 1, the less efficient they are.
There are various methods to evaluate efficiency, particularly when incorporating multiple inputs and outputs. We used a sample of UK and Ireland water and sewage companies to demonstrate the differences between using the standard (non-bias corrected) data envelopment analysis (DEA) model, and an updated double-bootstrapped DEA model (bias corrected). With the older standard DEA model, it appeared that the sample could on average reduce their inputs by 12.3%, whereas the double-bootstrapped model suggested this was 19.4% (Figure 1). The different methods also resulted in over 65% of the sample changing their rankings. This shows the importance of using the correct method and understanding the positives and limitations of the methods.
Incorporating sustainability into the analyses
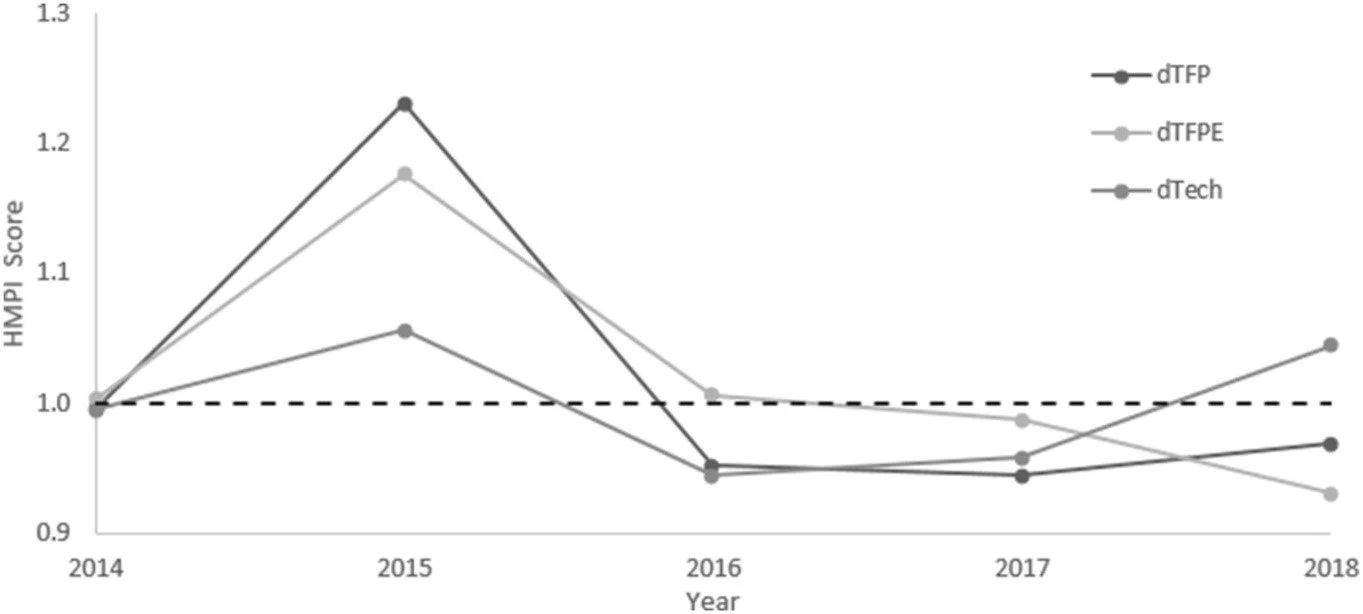
The water sector provides a core service in society and consumes between 2-3% of energy globally at the cost of billions of dollars. Since the sector has such a big impact on society, it is important that it contributes positively in a wider sustainability setting. One of our studies used renewable energy generation, customer satisfaction, water supplied and wastewater treated, and total expenditure as indicators to capture sustainability. Figure 2 displays the efficiency results (measured as total factor productivity(dTFP)) of the UK water sector and shows an improvement of 1.8% compared to the reference year of 2014. This is a positive result however, there are still improvements to be made both by the companies in providing better service at a lower cost to the environment, and by the researchers in optimising sustainability analysis, which is our plan for the near future.
Figure 2. The change in total factor productivity (TFP) for all UK water and sewage companies as a collective for 2014–2018. A HMPI score of 1 = productivity has remained the same, >1 = improvement, <1 decline. TFPE and Tech are technical elements of TFP, ignore them for now, unless you want to read the full study.
Energy intensity across wastewater treatment utilities: a global perspective
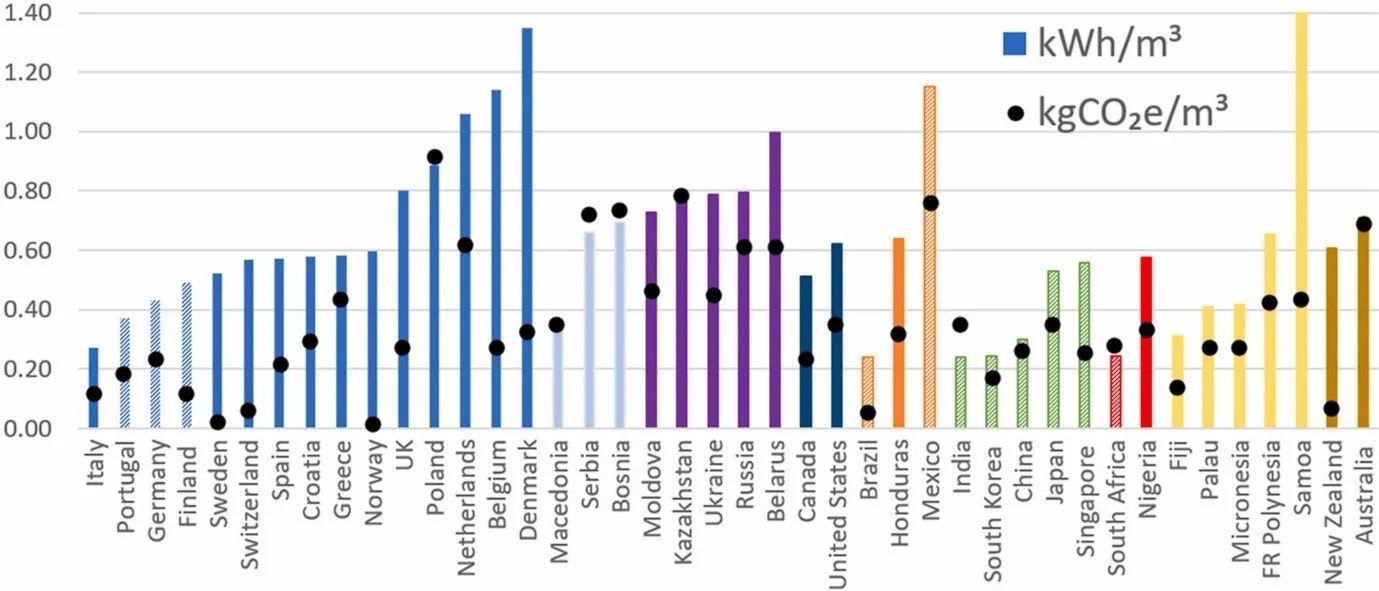
The majority energy use from the water industry is for wastewater treatment. To investigate areas to improve wastewater treatment, international benchmarking on energy intensity was conducted with the indicator kWh/m3, which included over 330 companies from 42 countries. The global average consumption for wastewater treatment was 0.89 kWh/m3 and in the regional analysis (Figure 3), EU states had the largest average kWh/m3 with 1.18. Countries with the lowest energy intensity varied from Brazil, India, South Korea, and South Africa (averaging 0.24 kWh/m3). This appeared to be a symptom of the energy data being gross consumption and there being a disparity between wastewater quality standards since energy production at treatment plants was not captured and the lowest energy consumers had some of the worst standards. It is expected that as regions with lower effluent standards improve to similar levels of advanced economies, their energy consumption will increase.
In addition to energy intensity, the associated greenhouse gas emissions were calculated enabling the targeting of regions for improvement in response to climate change. Poland had the highest carbon footprint (0.91 kgCO2e/m3) arising from an energy intensity of 0.89 kWh/m3; conversely, a clean electricity grid can affectively mitigate wastewater treatment inefficiencies, exemplified by Norway who emit just 0.013 kgCO2e per cubic meter treated, despite consuming 0.60 kWh/m3.
Figure 3. Energy intensity (kWh/m3) and associated greenhouse gas emissions (kgCO2e/m3) for all countries in the core sample, supplemented by external WWTP data, represented by striped columns (42 countries in total). The colours represent regional separation.
The references and links to the full research journal articles are here.
Research impacts
The research outlined here addressed many knowledge gaps and can have implications for academics, performance analysts, water managers, and regulators. This could be through learning from the use of novel econometric methods on the water sector, and unique indicator applications both in the efficiency analyses and the exploration of influencing factors. Furthermore, there is value in the wide-spread data collection and analysis that delivered an up-to-date account of UK water sector and international wastewater efficiency. Collectively, the work can inform decisions made within the water sector and gives a platform for analysts and academics to build upon both now and in the future.


